
‘It is the only universal currency’, states Vaclav Smil in his book, Energy and Civilization: A History. Nothing can be done without it. ‘Humans have come to rely on many energy flows - ranging from fossil fuel to photovoltaic generation of electricity - for their civilized existence’. Human evolution, for better or worse, cannot be understood without our growing consumption of energy.
(Source: Vaclav Smil, Energy and Civilization: A History, The MIT Press, 2018)
Evolution of Global Direct Primary Energy Consumption (measured in Terawatt/hour)
It is estimated that humanity reached the first billion people by 1810. According to Smil, the world total primary energy consumption back then was 5.961 TWHR (terawatt-hour) and most of it (5.833 TWHR) was from traditional biomass as Coal was the only alternative available. By 2010, 200 hundred years later, the population of the world reached 7.5 billion people and the world’s energy consumption reached 141.057 TWHR. So, while population has grown 7.5 times, energy expenditure has escalated more than 20 times. It is quite evident that human progress has come at a cost of an ever-increasing energy demand; something that, taking into account our still heavy dependency on non-renewable energies, is the kernel of our present unsustainable lifestyle.
(Source: Our World in Data)
2019 Energy Consumption by Type of Fuel (measured in exajoules)
This unsustainability is even more evident if we consider the composition of the energy mix. According to BP’s Statistical Review of World Energy. The total consumption of all the renewable energies combined is about a third of any of the major three fossil fuels. Fuels that we have to remember are finite.
Evolution of Primary Energy Consumption by World Regions and Type of Energy (measured in exajoules)
BP divides the world into 6 regions: Africa, Asia-Pacific, The Commonwealth of Independent States (essentially the former USSR), Europe, Middle East, North America plus South and Central America. The data shows that all regions, except CIS, have increased their energy consumption. However, the highest rise is in the Asia-Pacific region where consumption has increased by 12 times in 54 years.
2019 Share of Primary Energy Consumption Per Country
According to BP, in 2019, China alone used 24.3% of the world’s total energy consumption. However, when we consider that China has almost 19% of world’s total population, and is the main maker and supplier of goods and products, the figure is not surprising.
By comparison, the US consumption of 16.2% is more shocking. Especially if we take into account that, despite its huge industrial system, the US only has 4.26% of the world’s inhabitants.
Note that just four countries - China, USA, Russia and India - account for more than half of the world’s total energy consumption (51.45%).
2019 Share of Primary Energy Consumption Per Capita (measured in gigajoules per capita)
If we examine per capita energy consumption the results are dramatically different. Asia’s per capita use amounts to a modest 61 gigajoules per capita (GJPC) in comparison to the huge 236 GJPC of North America. The more sustained growth is in Africa, from 7.9 to 15.2 GJPC, and Europe, from 93.4 to 123.6 GJPC.
Only North America and Europe are reducing their energy expenditure per capita. On the opposite scale, the region with the highest consumption is the Middle East - no doubt because of its significant production of oil and natural gas.
(Source: BP, “Statistical Review of World Energy)
2019 Fossil Fuel Production Per Country (measured as percentage of world’s total production)
If we analyse the production of fossil fuel, we can see that many Muslim countries are amongst the world’s top producers, particularly in oil and natural gas.
Coal is the fossil fuel with the highest ratio of CO2 production. Yet, China is still very dependent on coal. The country produced 47.31% of 2019’s total coal production and even that is not enough for its needs. In 2019, China consumed 51.7% of world’s coal production.
(Source: BP, Statistical Review of World Energy)
Muslim Countries’ Share of Proved Oil Reserves
What is shown here is the share that different Muslim countries have of the total world proved oil reserves in 2019. And, as it can be seen, some of them have significant fossil fuel stocks. In the case of oil, Saudi Arabia, Iran, Iraq, Kuwait and UAE have 46.1% of the world’s reserves. If we look at natural gas, just Iran, Qatar and Turkmenistan contain 38.3% of the world’s supply.
(Source: BP, Statistical Review of World Energy)
2019 Muslim Countries’ P/R ratio
How long will this reserve last? This is what the P/R ratio aims to answer. The ratio divides the reserves remaining at the end of any year by the production of that same year, and the result is the number of years the reserves will last - provided production remains stable.
As the graphic illustrates, some of the main producers do not have good ratios. In fact, the three countries with best ratios (Yemen, Iraq and Syria) currently have low production because of persistent conflicts.
So, even the big producers will soon have to choose between reducing production or opting for other sources of energy.
(Source: BP, Statistical Review of World Energy)
2019 Production of Renewable Energy by Region and Energy Type (measured in terawatt/hours)
The Asia-Pacific region leads the production of renewable energies in every kind of energy. But very few Muslim countries have significant productions of renewable energy.
The main exception is Indonesia. In 2019, Indonesia generated 134.9 TWH making it one of leading producers of renewable energy in the world. Other countries taking relevant steps: Turkey made 45.3 TWH, Egypt 6.5 and Morocco 6.3 TWH.
(Source: BP, Statistical Review of World Energy)
Best Muslim Countries in Climate Change Performance Index Ranking
Morocco, Indonesia, Egypt and Turkey are the best rated Muslim countries in the Climate Change Performance Index (CCPI). The CCPI is a tool to track countries’ activity regarding climate protection. Right now, it covers 57 countries plus the EU. It measures four big categories, and the combined result is the index itself. The categories are:
- Greenhouse Gas (GHG) emissions, which measures the GHG emission per capita and represents 40% of the index.
- Renewable Energy, that calculates the share of RE from the country’s total energy expenditure. It amounts to 20% of the overall score.
- Energy Use, which analyses each country’s energy efficiency. It is the category on which the global performance is worse, and it is another 20% of the CCPI Index.
- Climate Policy is the only category that includes qualitative indicators and aims at determining each country coherence (or truthfulness) when fighting climate change. It constitutes the final 20% of the score.
(Source: CCPI)
An Alternative Path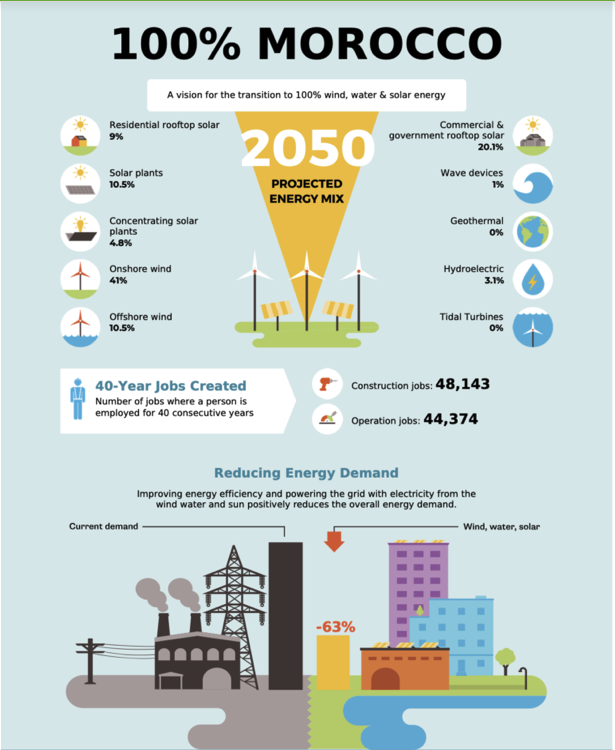
It is important to note that Morocco, Indonesia, Egypt and Turkey are not just among the top 50 in CPPI Index, but they have a considerable lead. Morocco provides a good example. It has an ambitious plan to cover 50% of its energy needs by 2030, and 100% by 2050, with renewable sources.
Collectively, the four countries provide an alternative path to sustainability; and serve as a model for other Muslim countries.
A more sustainable future demands that the current energy use models are substantially transformed.
(Image from The Solutions Project)