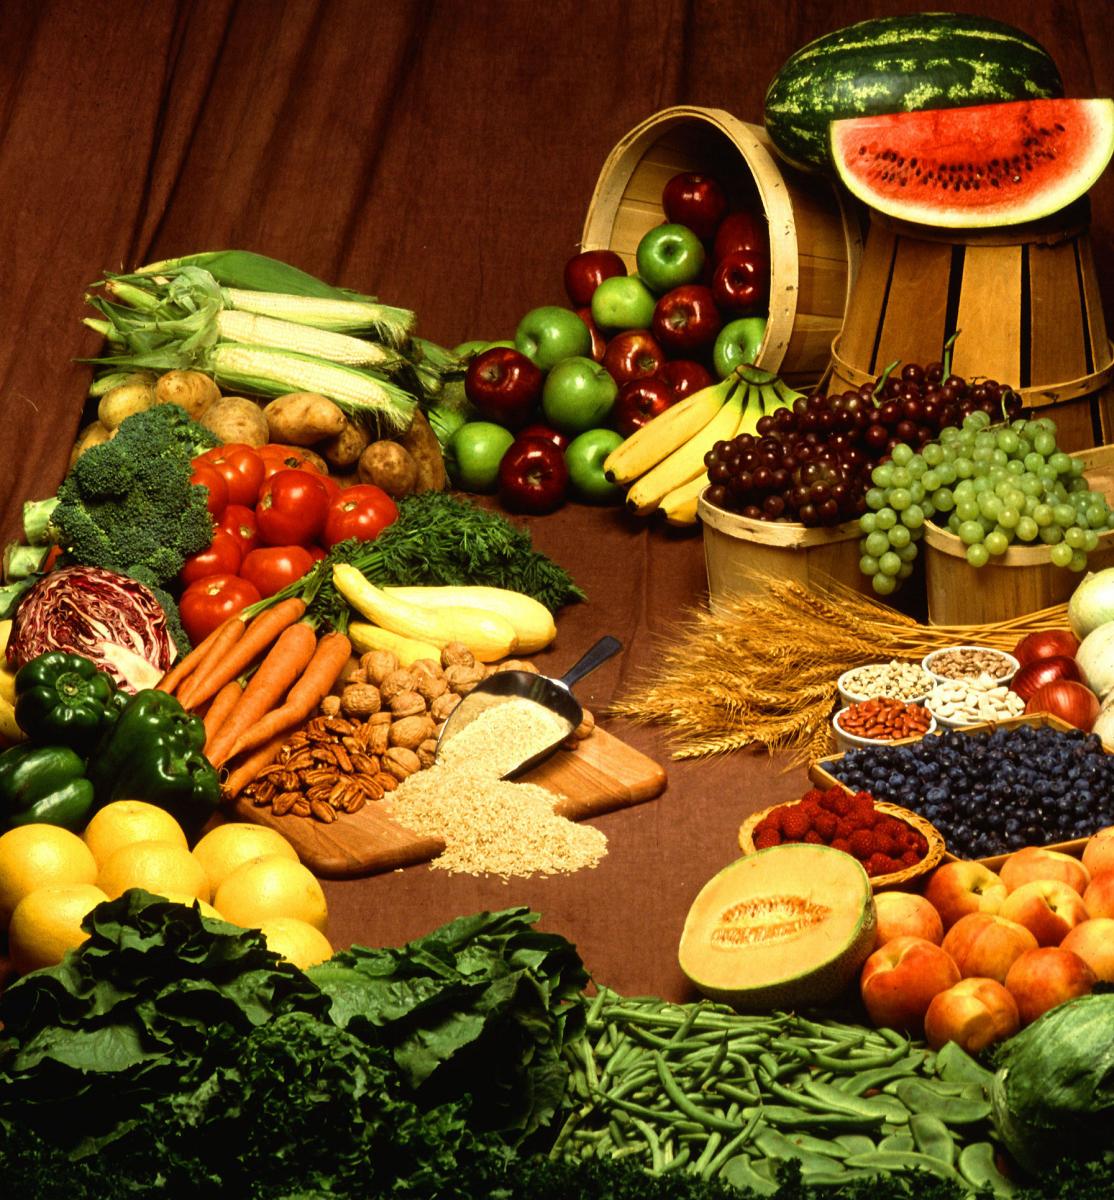
But, how much food do we actually produce?
It turns out that we grow a lot of vegetables. According to Beef2live, if we consider the 43 most produced vegetables, it turns out that we produce 472,031 pounds every second, which amounts to almost 18.5 metric tons per day.
On the whole, the production of vegetables has grown steadily since 1961, when it was 2,039 million of metric tons. In 2018, it reached 6,861 million metric tons.
Data from FAO.
This growth is the result of a substantial improvement in crops yield. Taking the production of 1961 as a reference, we can see that every year we needed smaller areas to grow the same quantity of food. We currently use a third of the land we required in 1961 to produce the same amount of food.
Data from Our World in Data.
A close look at cereals, the main diet for most people, confirms this. While the growth in arable land has been moderate, from 647 to 728 million hectares (ha), the increase in yield is quite phenomenal - from 13,532 in 1961 to 40,684 2018 hectograms per hectare (hg/ha). We have clearly got clearly better at growing crops.
Data from Our World in Data.
Nevertheless, globally we are devoting more land to agriculture. The percentage of arable land has augmented overall. Specially in the last 10 years after some decrease during the 1990s. This last increase though is a source of concern as we will explain in a while.
Data from the World Bank.
It is worth noting that only four countries are the top agricultural producers: Brazil, China, India, and the USA. This makes sense as it takes a lot of hectares to produce crops at that level, and only a few countries have the area and the conditions to achieve this. However, we can see that there are some differences among them. India devotes the largest area but has the lowest yield, more or less like Brazil. China on the other hand, has boosted both its production and yield but it still needs to import food to feed its enormous population. Finally, both USA and Brazil have large productions but, as we shall see, a lot of this food is not really for human consumption.
Data from FAO.
Cereals are widely distributed all over the world. This sample includes all main varieties of cereal such as maize, wheat, rice, barley, rye, millet, and others.
The reason some countries seem to have no production at all is mostly due to political developments - for example, the division of USSR or Yugoslavia into several countries. Thus, some of the current countries did not exist as such thirty years ago.
Data from Our World in Data. Production measured in metric tons.
While cereals are main basic food, the most harvested plant is sugar cane. In this graph we have also included sugar beet. And judging, from the sugar crops production, it is quite clear that humans have a weakness for sugar.
Data from Our World in Data. Production measured in metric tons.
The third main group of agriculture products are roots and tubers. In this sample we have included: cassavas, potatoes, sweet potatoes, and yams.
Data from FAO. Production measured in metric tons.
Fruits and vegetables are another important group of food for human nutrition. Here, we have included apples, avocado, bananas, grapes, oranges, and tomatoes. The increase of avocado in the last 30 years is worth noting.
Data from FAO. Production measured in metric tons.
Then there are legumes. Here we have included beans, cashew nuts, chickpeas, green peas, and soybean. Of all the food groups considered so far, legumes are the less widely distributed both due to climatic factor and cultural elements. However, one plant is changing the situation: soybeans.
Data from FAO. Production measured in metric tons.
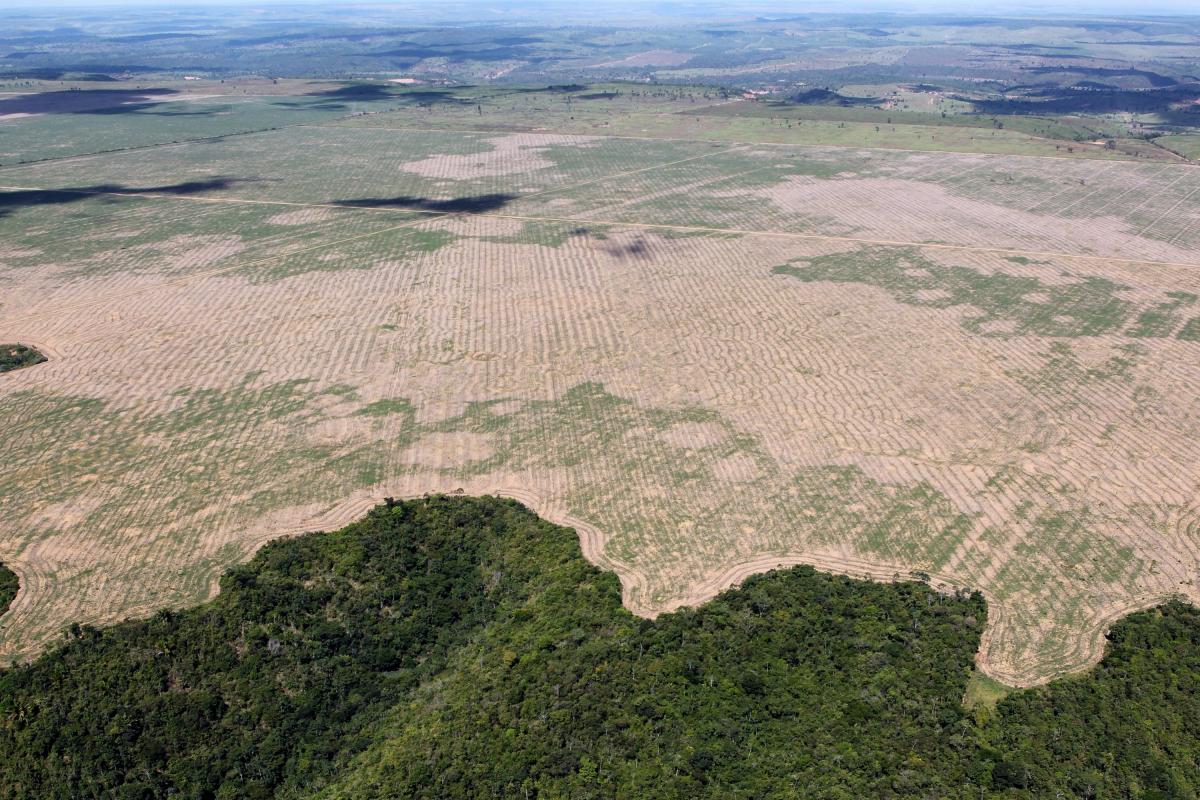
Soybean could easily qualify as an oil crop as its main use is to produce oil, either for human use or as a biodiesel. It appears that more than three quarters of the production is for animal feed. But this is misleading, as this feed is just the toasted by-product of the process to extract oil. Soybean is rich in oil, protein, and fibre and this is why it is so profitable. The three main producers of soybean are Brazil, USA and Argentina - together, they generate 79,64% of world’s total harvest and most of it is for oil and animal feed (mostly to cover China’s gargantuan demand). But this comes at a high environmental cost; it is becoming one of the main causes of deforestation in South America.
Data from NC Soybean Producers Association and Phys.org
The loss of forest in general, and rain forest especially, is another major source of concern. Woodlands have acted as carbon depositories for centuries. Cutting them down for agriculture purposes increases the concentration of CO2 and Green House Gases (GHG) in the atmosphere.
We cannot ignore the fact that agriculture, forestry, and the change of land use account for 24% of GHG emissions. Among these two are particularly concerning: nitrous oxide, of which agriculture generates 60% of total emissions, and methane. Globally, agricultural methane and nitrous oxide emissions have increased by nearly 17% from 1990 to 2005, an average annual emission increase of about 60 metric tons of carbon dioxide equivalent per year.
Source IPCC 2018
Agriculture poses another environmental challenge: use of water. According to OECD, ‘irrigated agriculture remains the largest user of water globally, a trend encouraged by the fact that farmers in most countries do not pay for the full cost of the water they use. Agriculture irrigation accounts for 70% of water use worldwide and over 40% in many OECD countries. Intensive groundwater pumping for irrigation depletes aquifers can lead to negative environmental externalities, causing significant economic impact on the sector and beyond. In addition, agriculture remains a major source of water pollution; agricultural fertiliser run-off, pesticide use, and livestock effluents all contribute to the pollution of waterways and groundwater.’
Data from OECD.
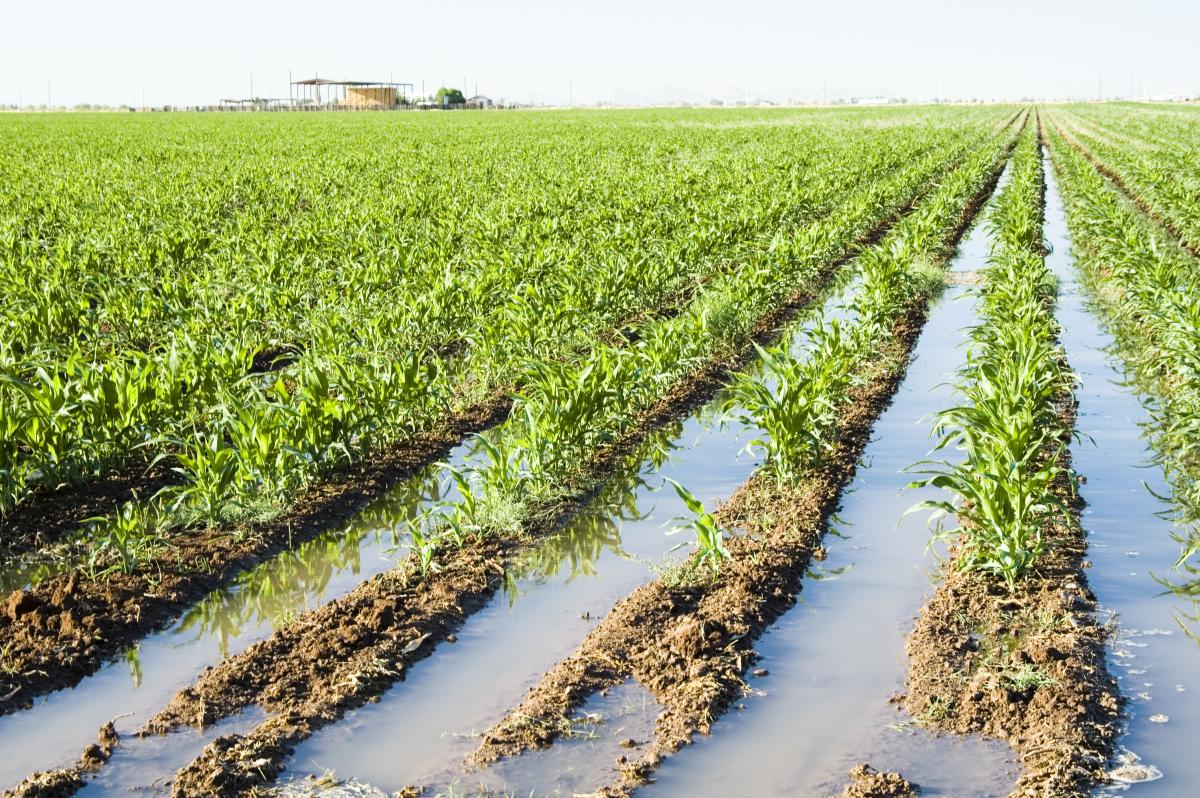
If we analyse the water withdraw in relative terms, we see that, on average, agriculture accounts for 70 percent of global freshwater withdrawals. With a growing demand to feed the increasing population, FAO estimates that irrigated food production will increase by more than 50 percent by 2050, but the amount of water withdrawn by agriculture can increase by only 10 percent, provided that irrigation practices are improved, and yields increase.
And, as we can see, some regionas do need to improve its efficiency in the water use.
Data from FAO report Water for Sustainable Food and Agriculture.
The global farm poses serious future challenges - not only for the sustainability of the planet but also for human food security. We analyse these challenges in part 3 of this dominant trend on food.