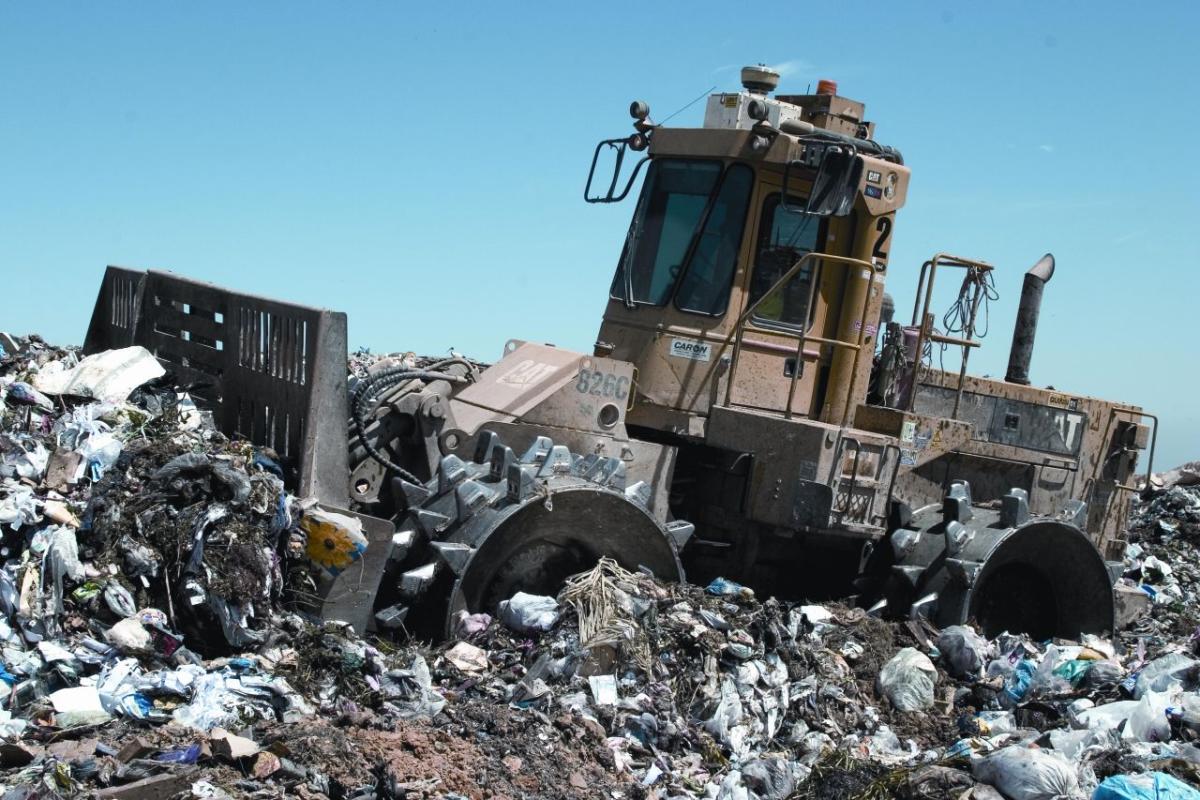
The impact of humans on Earth is huge. We are endangering the whole biosphere by consuming resources beyond the world’s capacity to regenerate them. But it is not only what we take from the planet, it is also what we throw away in it. We are producing waste to a level that the natural systems cannot absorbs, dissolve, or integrate it in any way. Plastics would be the obvious example but there are many other hazardous materials and substances.
According to the World Bank in 2016 we generated 2.01 billion tonnes of municipal solid waste. If the trend is not mitigated or, better, reversed, it will raise to 3.40 billion tonnes in 2050. And the world cannot handle so much garbage.
But what is waste composition?
From the World Bank data, we can tell that almost half of it is food and vegetal material. While other recyclables products such as plastic, paper and cardboard, metal, and glass total to 38% of waste.
Of all these figures, one is particularly concerning, food waste. And most of this refuse is generated in the households. The figures are kilograms per capita and, if we compare the volume of food waste per capita in different regions of the world, we can see that, on average, wherever the income level is lower the percentage of organic waste is higher.
Source Statista, data from 2021.
If we dig deeper regarding which countries generate more food waste and where this refuse is produced, we find some surprises. Once again, figures are kilograms per capita.
First, Malaysia is the only country that tops two categories: out-of-home and retail food waste; clearly Malaysia can do better at selling and take-away food. In any case, in these two categories, there are no low-income countries. This means that the waste is generated by inefficient distribution systems and unsustainable shopping models.
Yet, if we focus on the household category we can find several states where, most likely, people do not have reliable infrastructures to preserve food at home.
Source: Our World in Data, data from 2019.
Image by Surang at Flaticon
Waste, as we know it today, is another by-product of industrialization and the push to make us consume more and more. In this regard plastic has become a key element allowing for cheap one-use bottles and containers. Too much plastic products are used once and thrown away subsequently. This means that regardless the length of its useful life, these plastic containers will become a waste that will last for centuries.
This graph shows the world measurements (in kg per capita) in 2010 before treatment. And let us not forget that plastic waste can take up to 600 years to biodegrade.
Source, Our World in Data
And it is precisely because of its longevity that countries have developed all sort of strategies to get rid of this lasting refuse. One common way is to export plastic waste to other countries where environment protection is weaker.
Here we can see the top ten exporting countries, the only country that seems to be misplaced is Sri Lanka, but small islands are, in general, exporters of waste as they often lack proper recycling (or dumping) places.
Source: Trademap
Image by phto3idea_studio at Flaticon
Plastic waste longevity has another particularly negative effect. A great deal of this waste ends up in the ocean. And most major rivers have become fast lanes for plastic waste to reach the ocean. The map shows results from 2019 and the measurements are in kg per person. Yet, these estimations do not include the waste that is exported, since this plastic has a higher probability to end up in the ocean at its destination, this export practice effectively becomes a greenwashing strategy for the exporting states.
Source, Our World in Data
Turning the ocean into a massive dumping site is not working very well. Apart from the damage to the marine life, waste is beginning to negatively affect tourism in places where they needed it the most (like in Bali). But the most significant impact is the generation of huge plastic islands in the sea. The most know is the Great Pacific garbage patch that covers around 1.6 million square kilometres. But there are more, the oceanic currents group them in big patches as we can see in this NASA’s simulation.
The most concerning aspect of these plastic accumulations is that, eventually, all this plastic will break down into microplastics that, nowadays, are already present in all Earth water systems and, also, in our blood stream; yet the long-term effects of these microplastics are still mostly unknown.
Nowadays we also must take care of a new kind of waste, electronic waste, or e-waste. This is a broad category as it includes large household appliances like a fridge, but also toys, ICT devices, tools, etc. Currently almost anything can carry an electronic circuit in it.
In the graph we can see its growth and its projection until 2030 (measured in million t). Nonetheless, it has to be stressed that most of this waste can be repaired, reused, recycled or salvaged. These practices make economic sense as often this waste contains valuable materials, like precious metals. Yet, according to UN environment program, less than 20% of e-waste is formally recycled, most of rest is sent to developing countries where it is informally recycled becoming a serious hazard for the workers as this waste can contain substances like mercury, lead, or cadmium.
Source: Global E-waste Monitor 2020
Image by Freepik at Flaticon
Here we can see the top 10 world producers of e-waste. Something must be noted though, e-waste trade is a big business, similar to that of plastic waste, and two countries in the ranking import massive quantities of e-waste: Indonesia and China.
In China we find Guiyu, in the Guangdong province. Formerly an agricultural region, Guiyu has become the e-waste World capital creating a complex in which some villages focus in dismantling circuit-boards, others process plastic and metals, others in wire and cable peeling to make sure that even the tiniest bits of copper are salvaged. Yet all this to a high environmental and health cost.
Source: Global E-waste Monitor 2020. Measured in million t.
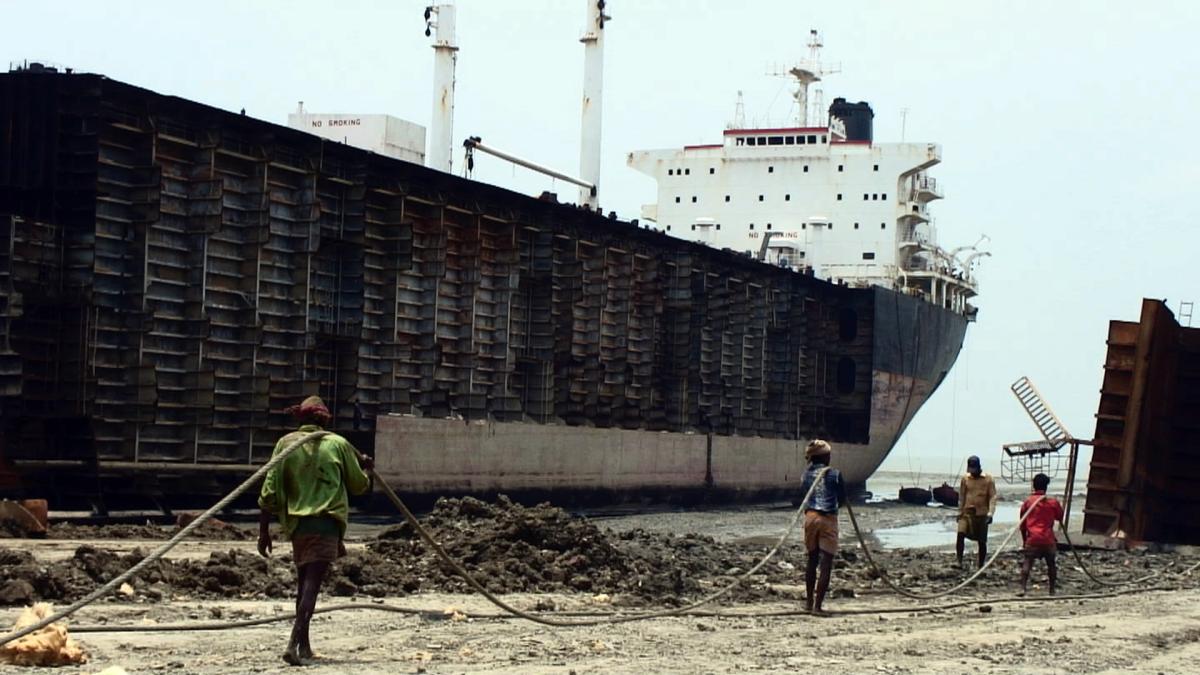
Hazardous waste is becoming an increasing worry for many countries. Particularly developing countries that, despite they lack proper infrastructures to deal with these products, do import them to make some income of storing, dismantling, or restoring them.
This waste encompasses materials that are ignitable, and/or reactant, and/or corrosive and/or toxic and that can be present in different states (gaseous, liquid, or solid).
Some treaties have been enacted like the Basel Convention to regulate the trade and handling of this waste. Unfortunately, many people in developing countries are forced to manage dangerous waste as there are no available labour alternatives. Like these workers in Chittagong (Bangladesh) ship breaking an old vessel.
In this map we can see the amount of hazardous waste per capita each country holds. Kazakhstan immediately catches the eye. The country lacks proper solid waste management infrastructure and, nevertheless, it keeps producing billions of tons of industrial waste each year that adds to the fact that Kazakhstan used to be the testing site for rockets and nuclear weapons for old USSR.
Source: UNstats. Measured in Kg per capita.
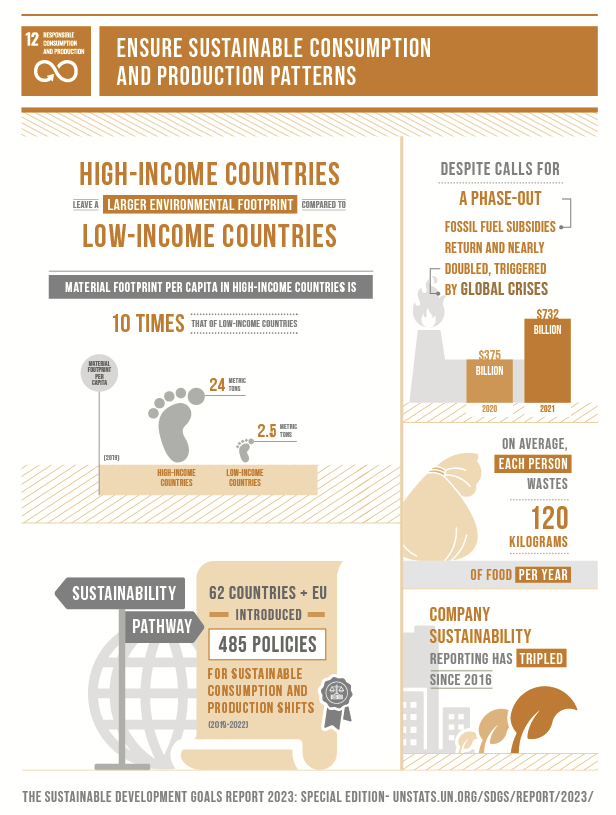
It is high time that humanity finds an alternative to the current system of buy, consume, and throw away. It is unsustainable, dangerous, and deeply unfair for many people.
The 12th Sustainable development Goal call us to ‘Ensure sustainable consumption and production patterns’, and a very important part of this, is the three Rs approach: reduce, reuse, and recycle.